The whole picture: generation, load, and the regulatory record.
Every US interconnection queue snapshotted daily, data center permits as they land, and millions of pages of filings behind them, in one place. Connect the AI you already use and ask your hardest questions.
Example question: Goodnight Wind II in ERCOT shows an executed IA. Has its delivery date moved?
Answer: Yes. Its proposed COD slid four times, from 2025-11-29 to 2027-06-14 (554 days), with the IA executed throughout. On 2026-07-03 it moved up 8 days to 2027-06-06, the first change toward sooner on record. Source: ERCOT 23INR0637, GridTracker queue change log.
Example question: What's happening with large-load interconnection rules for data centers in Texas?
Answer: ERCOT is evaluating more than 438,000 MW of large-load requests — roughly 89% tied to data centers — and Senate Bill 6 now requires interconnecting large loads to meet financial, planning, and operational standards. Source: PUCT Project No. 59824, public comments (June 2026).
Example question: How much battery storage capacity entered the interconnection queue in the last 12 months?
Answer: Roughly 147 GW across 636 projects since July 2025, against 1,860 GW of active capacity in US queues today across all technologies (per the 2026-07-12 snapshot).
Example question: What's the current status of the Stargate data center project in Abilene?
Answer: Operational. The Longhorn Data Center (Stargate Abilene) in Abilene, TX is a 1,000 MW hyperscale campus in ERCOT, developed and operated by Crusoe Energy on a site owned by Lancium — tracked through 130 permit records since December 2021.
Data collection for LBNL's Queued Up is led by the GridTracker team. The queues we cover represent about 98% of installed US capacity.
- active queue projects
- 9,781
- active queue projects
- active capacity tracked
- 1,860 GW
- active capacity tracked
- data center facilities
- 9,596
- data center facilities
- queue snapshots since April 2024
- Daily
- queue snapshots since April 2024
Figures from the live dataset: queue snapshot 2026-07-12, data center data version 2026-07-09.
From a real research brief
What the press release leaves out
Press said a 1 GW-class AI campus was coming to the Texas Panhandle. The public record said more: who actually controls it, the shutdown obligation it carries, and a delivery date that quietly slid while its interconnection agreement stayed executed.
One project, traced through county permits, daily queue snapshots, and PUCT dockets. Every figure links to its underlying record.
See a Real Example Report11 months
Campus in official records before its regulatory fight surfaced in the press
525.5 MW
Full load must disconnect within 30 minutes on ERCOT instruction, per docket conditions
554 days
Co-located wind farm's delivery date slid across four revisions, IA executed throughout
MCP-enabled
Connect the AI you already use
GridTracker speaks the Model Context Protocol. Your assistant gets the full record; you keep your models, your workflow, and your private data.
Bring your own AI
Claude, ChatGPT, Copilot: whatever your team already uses. One connection URL, no new tool to learn, no lock-in to our models.
Your data stays yours
Your assistant reasons across GridTracker and your internal systems (deal pipeline, proprietary site data) in one conversation. None of that data ever reaches GridTracker.
No token markup
You pay your AI provider for inference and us a flat subscription. There is no per-question meter.
Answers cite the filing
Every claim links to the underlying record: the docket page, the queue entry, the permit. Verify anything yourself.
Ask across the whole record
Data center permits, queue history, and regulatory filings answer together, corroborating what a single source can't.
Current every day
Data refreshes daily, so your AI answers from today's queue and today's docket stream instead of a stale export.
Queue history
The queue, replayed day by day
GridTracker has captured every US interconnection queue daily since April 2024. A static export tells you where a project stands today. The change log tells you where it's headed.
- “Which ERCOT projects slipped their COD this quarter, and by how much?”
- “Show me every PJM project that executed an interconnection agreement in the last 90 days.”
- “What did the SPP queue look like the day the DISIS cluster results posted?”
The platform
The same record, in a browser
Everything the MCP serves your AI is also a click away for your analysts.
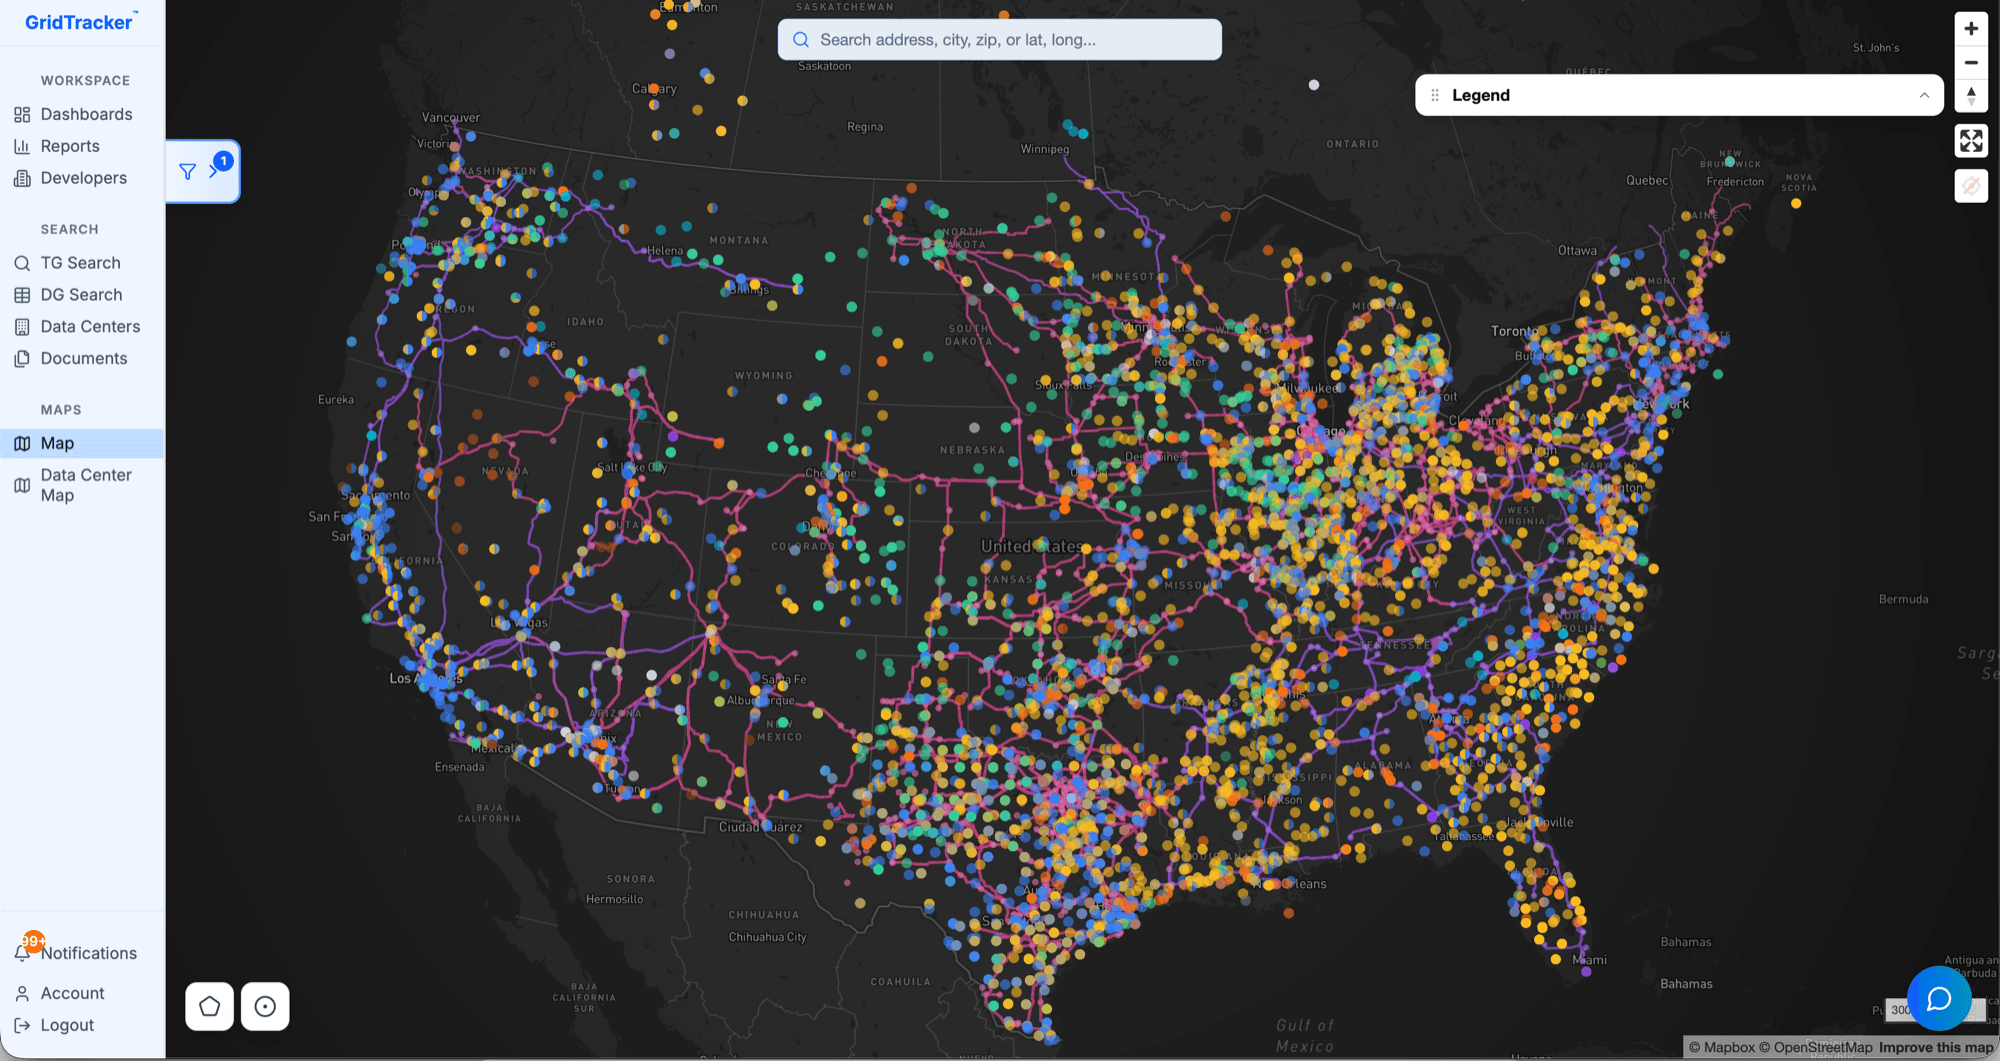
Every project on one map
49,000+ tracked queue entries color-coded by technology, plus transmission lines, substations, and data center sites. Click any marker for the full record: capacity, status, developer, point of interconnection, queue date.
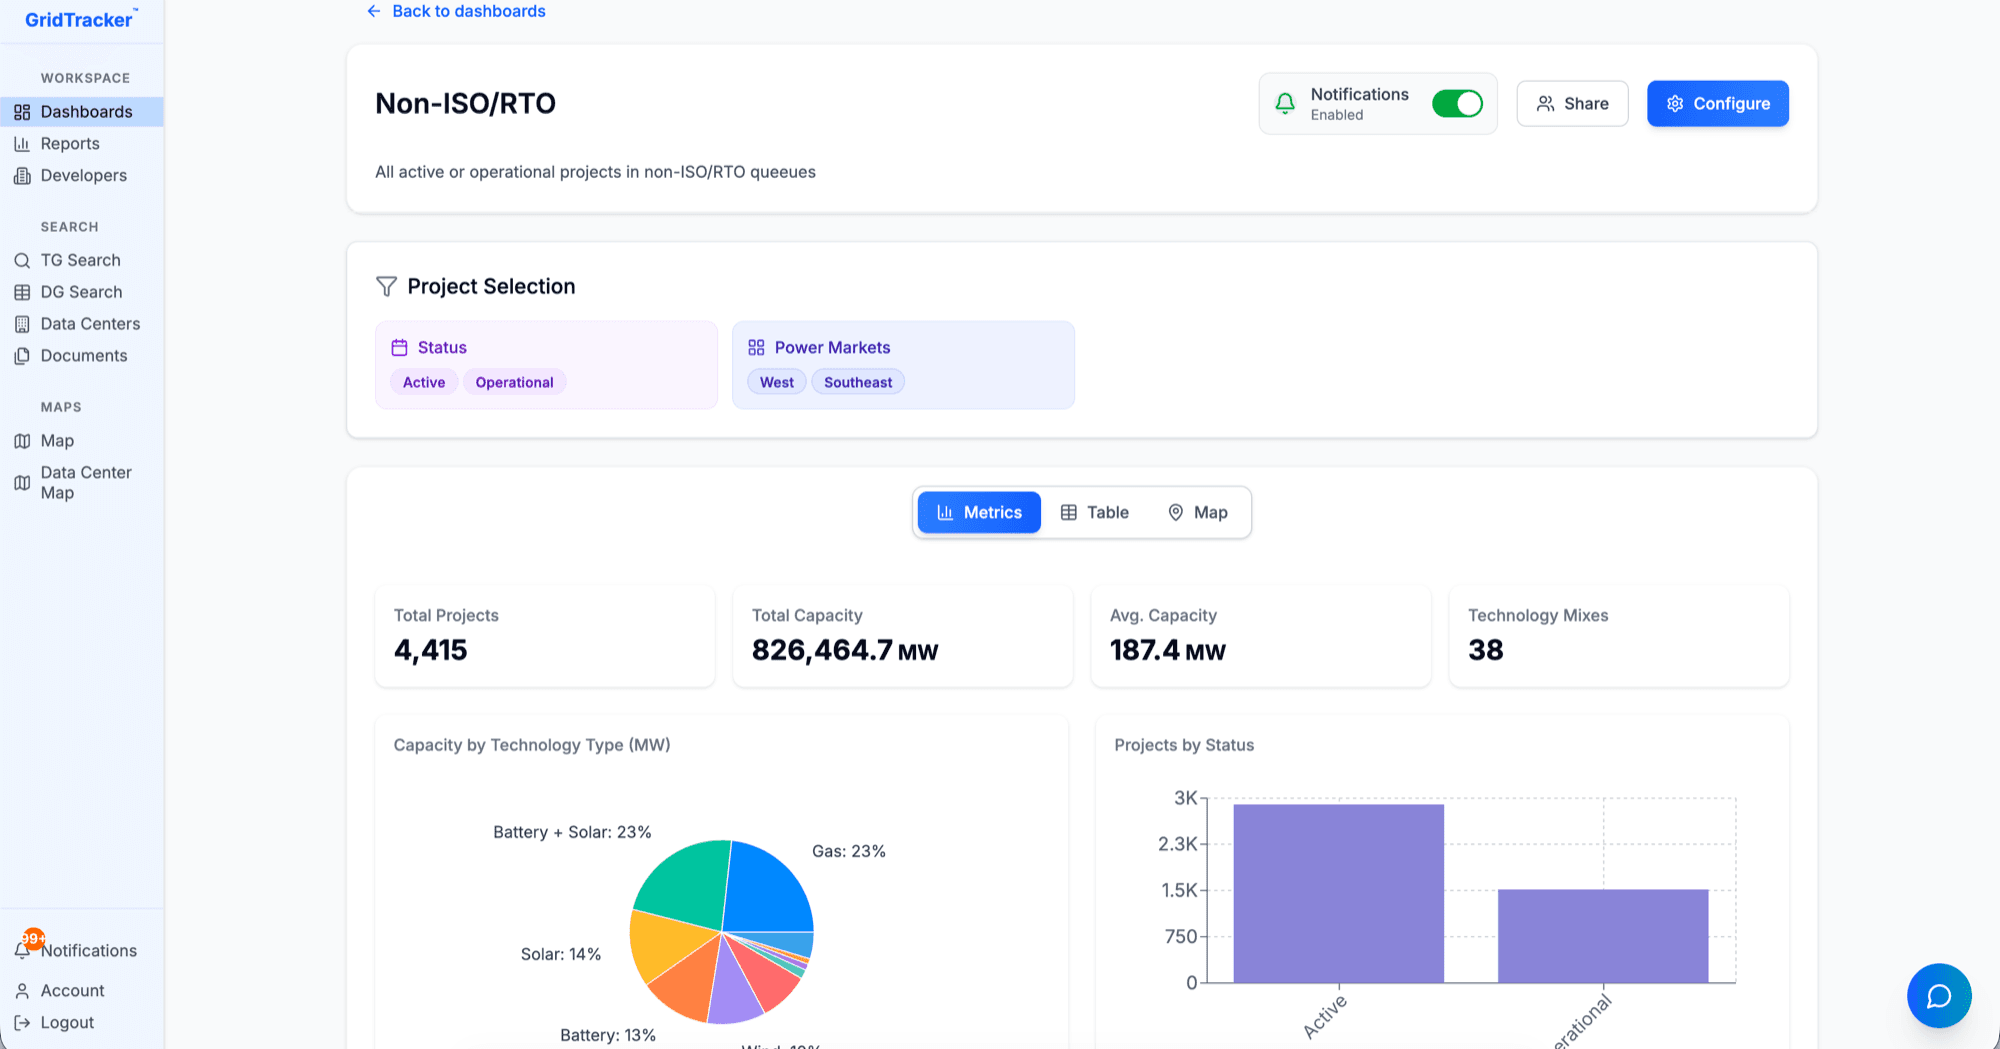
Dashboards that watch the queue for you
Save a filtered view, pin the metrics you track, and get notified when anything in it changes. The view shown covers 4,415 active and operational projects totaling 826 GW across non-ISO/RTO queues.
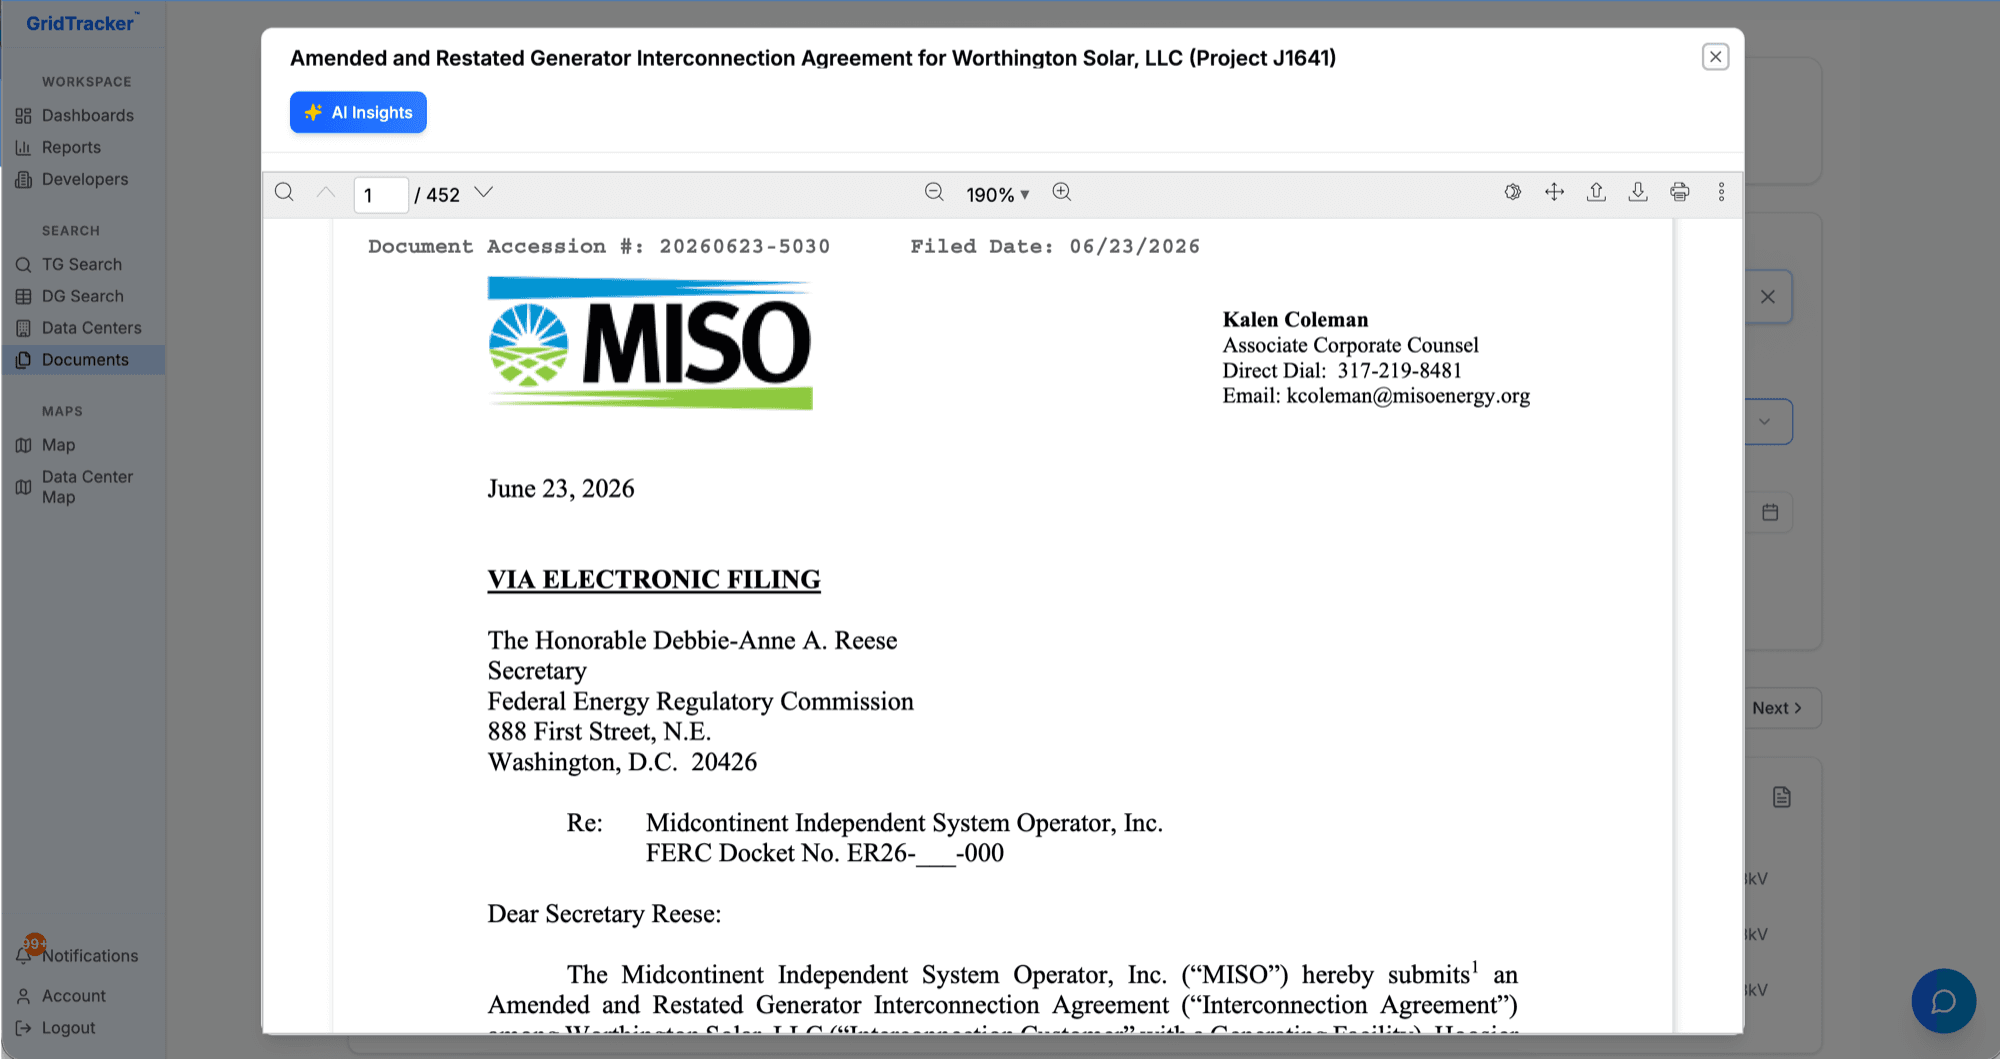
The filing itself, one click deep
Millions of pages of state PUC dockets, FERC filings, and grid operator studies, full-text searchable with AI Insights. Shown: a 452-page MISO interconnection agreement, open in the viewer.